This article covers advanced reporting features. If you've not done so, you many want to read about the basic features in the Reports article.
In this article, you'll find information on:
Filtering a report
Summary on a column
Drill Down reports
| NOTE: Some of the the examples here use a variant of the Material Sales report that can be created using the instructions given in the latter sections of the Reports article. |
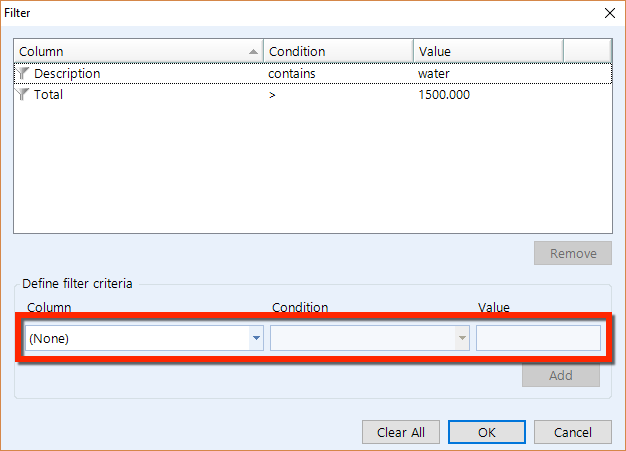
You can filter a report to include or exclude rows that contain data that matches specific criteria:
Click the Filter button in the ribbon to display the pop-up.
Choose a Column from the drop-down.
Choose a Condition from the next drop-down, such as equals, or contains.
Enter a Value, such as 1,500.
Click Add.
When you're done adding filters, click the OK button.
In this figure, there are two filters shown:
Removing a filter: You can remove one or more filters by opening the filter pop-up, clicking a filter, and then clicking the Remove button.
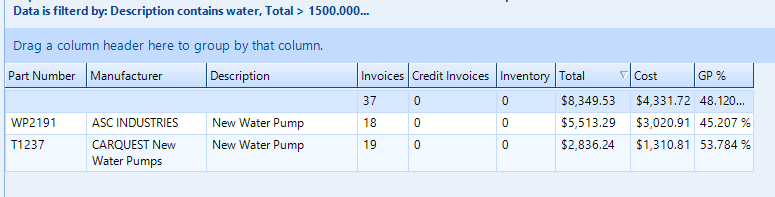
In the figure below, we see the result of the filter application above, in which only rows having a Description containing the word "water" and a Total that exceeds 1,500.00.
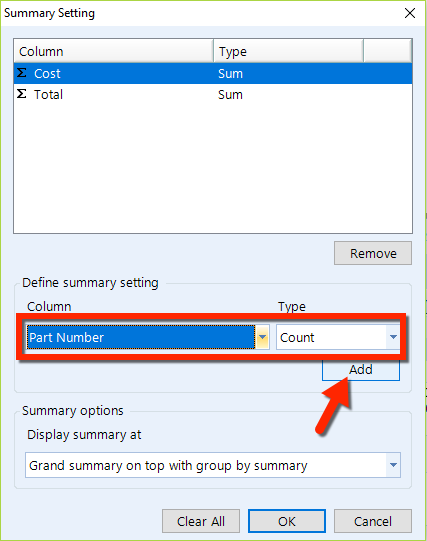
You can add summaries to your report. A summary is a calculation on the values within a column and may include a sum total, a count, a maximum, a minimum, an average, or a custom formula. Click the Summary button in the ribbon to open the popup, as shown in the figure below. Use the Column and Type drop-downs to add summaries for the columns on which you do want summaries.
Display Summary at: This drop-down will determine the place at which the summary appears (top or bottom of the report) and to what level of detail (grand summary or group summary). A grand summary is the total of the entire column; a group summary is the total for a specific grouping. Consider the case in which the material sales report is grouped by manufacturer and has a sum on the Purchases column. Choosing grand summary on top with group by summary would display the total of the entire column at the top of the page and would also display the total of each manufacturer group.
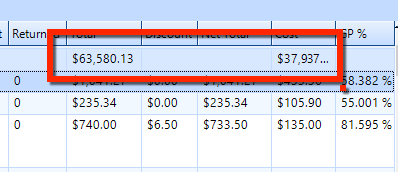
Here's an example of how summaries will appear on the report:
You can add one or more calculated columns to a report. The value of a calculated column results from a formula that includes the basic columns of a report. After opening a report, click the Calculated Columns button in the ribbon to open the popup window–as shown in the figure below. Some reports already have one or more calculated columns, which you can remove.
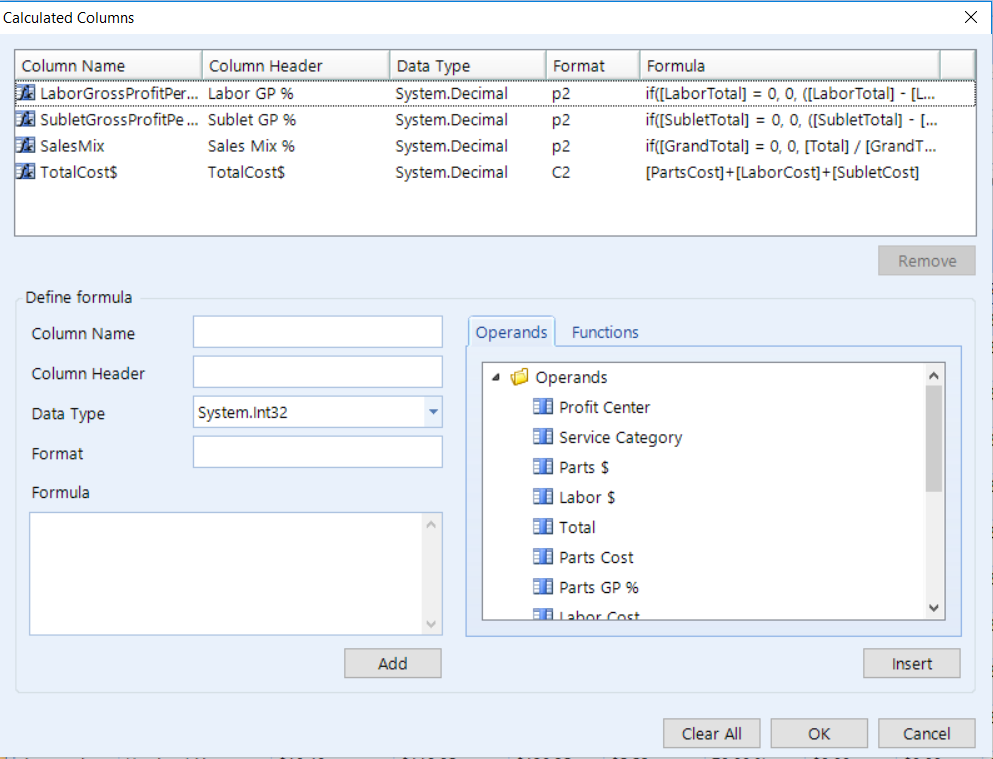
To add calculated column, you begin by defining a formula with a Column Name and Column Header–which appears at the top of the column and can be the same as the Column Name.
You'll also need to choose a Data Type for storing the information that you want to appear in the calculated column. which can be any of the following:
System.Int32 = An integer, which truncates and ignores any decimal part of the result.
System.Double = A double precision numeric data type that preserves the decimal in the result.
System.Decimal = A normal precision numeric data type that preserves the decimal in the result.
System.Boolean = The results is with true or false.
System.Datetime = Date/time format.
System.String = Text
Format Code
You also need to specify a Format,
which can be any of the following:
Code |
Format |
Example |
| C | Currency | $1,500.50 |
| F | Fixed Point | 1500.50 |
| N | Number | 1,500.50 |
| G | General | 1500.5 |
| P | Percent | 150050% |
To specify the number of decimals, append any of these to the format code that you choose:
0 - no decimals
1 - 1 decimal
2 - 2 decimal
Here are two examples of format codes together with data types:
C0 with System.Int32 = $1,500
C2 with System.Decimal = $1501.50
Double-click one of the Operands to add it to the Formula field. Add mathematical operators–such as +, -, *, or x–between operands to build the formula.
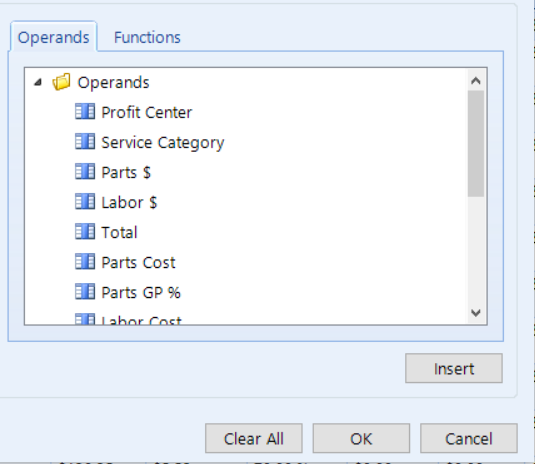
Here is an example formula, which might be given the name Total$:
[Parts$]+[Labor$]+[Sublet$]
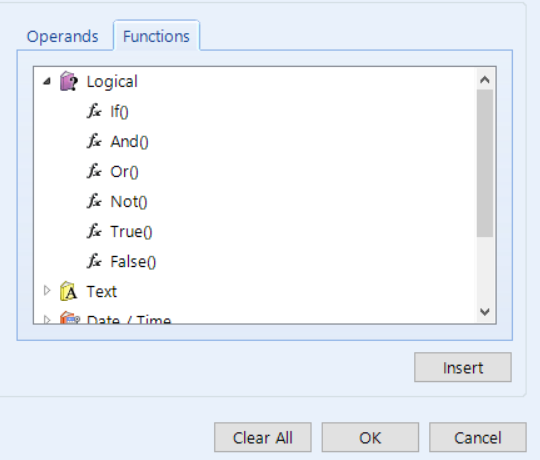
There are many types of functions available in the Functions tab:
Let's see how to add a calculated column to a common report. Click the Reports button in the ribbon, and then choose Common reports, and then choose Sales > Vital Signs by Service Category.

Set your filters and click the Execute button.
This report show component costs and profit values for various service categories, but we can augment this report with a column that calculates the total costs for a each category.
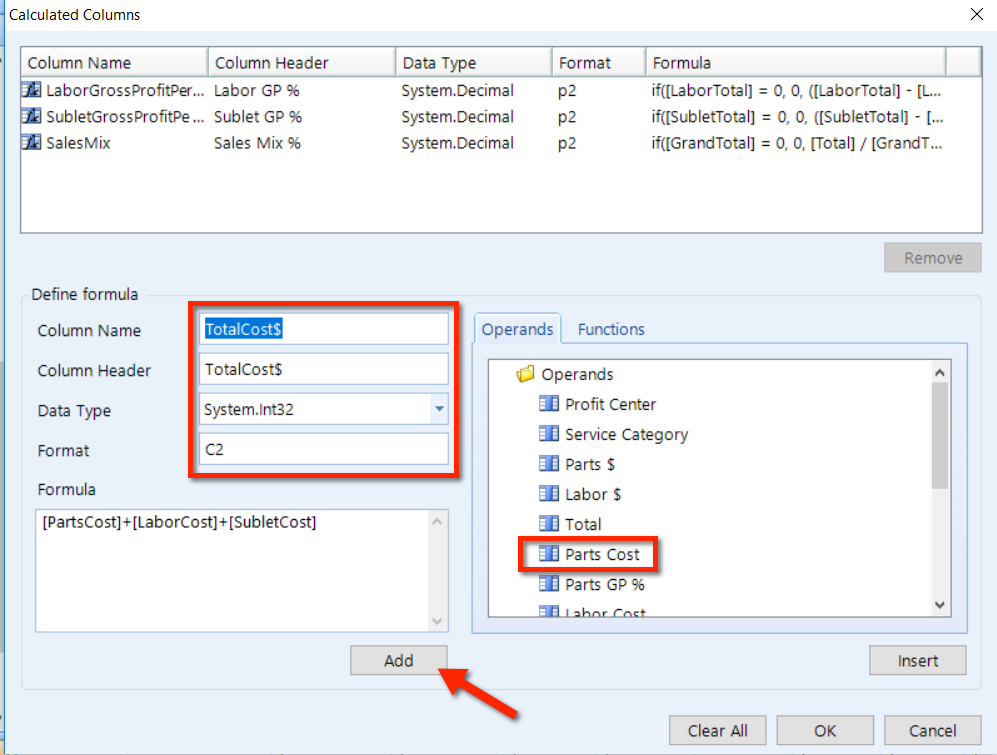
Click the Calculated Columns button in the ribbon to display the popup, as shown in the figure below.
Enter a Column Name and Column Header, choose a Data Type and specify a Format (such as C2). Add these Operands, separating each with a + symbol: PartsCost, Labor Cost, and SubletCost. The Formula field should contain the following:
[PartsCost]+[LaborCost]+[SubletCost]
Click the Add button and the new column will appear in the listing at the top of the popup. Click OK to commit your changes and close the popup window.
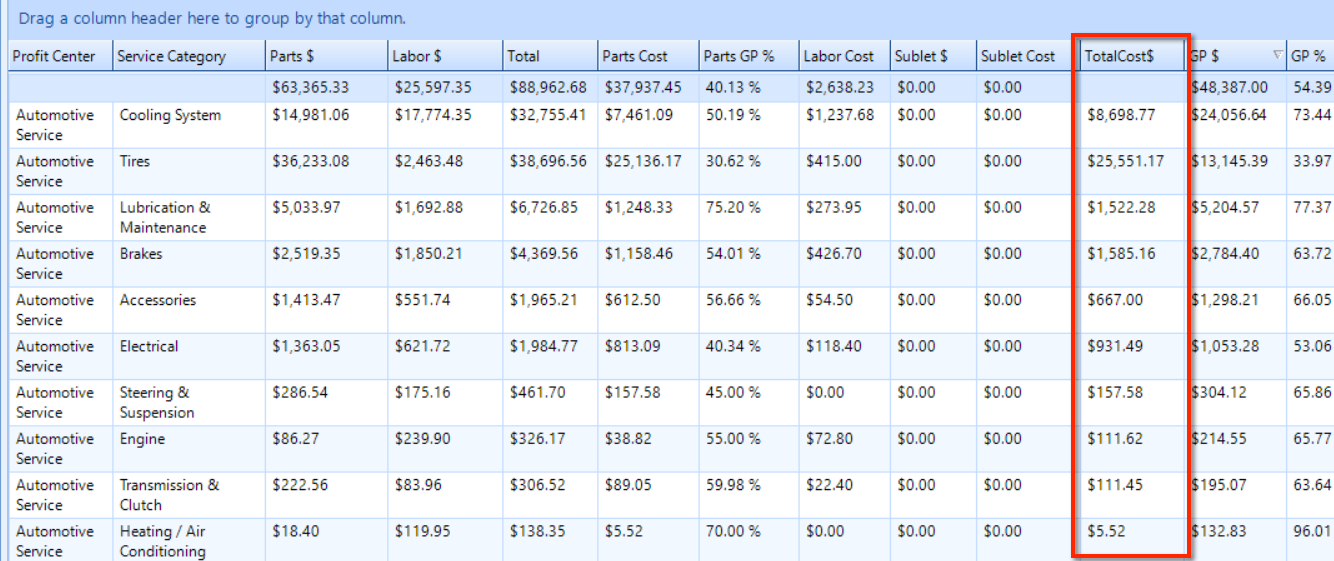
Look for the new calculated column on the far right. After rearranging the columns, you might prefer a layout similar to this:
To remove a summary, open the summary pop-up and choose the summary that you need to remove. Then click the Remove button.
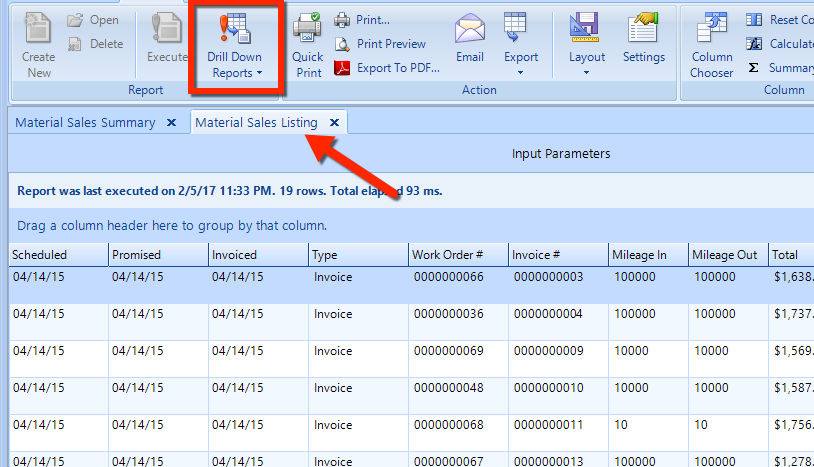
You can examine underlying details for one report by accessing the Drill Down feature. Click the Drill Down drop-down button in the ribbon, and then click one of the reports that you want to view.
You can also right-click over the listing and click Drill-Down > (Report name).
The drill-down report for Material Sales Summary is an Invoice/Materials Sales Listing, which will open as a separate tab (see the figure below). You can use any of the reporting functions on this report.